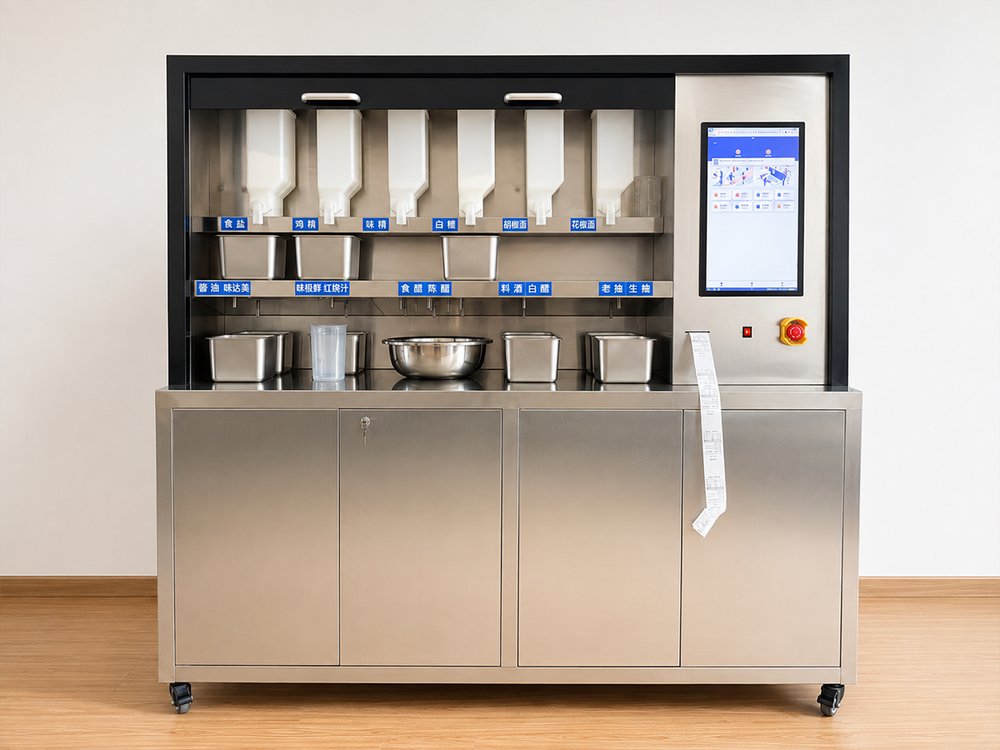
When dosing robots first arrived in the kitchen, everyone treated them as a machine that saves one person: weighing and dispensing automatically, taking the dosing work off someone's hands. Use one for a while and you realise the valuable thing about a dosing post is not the pair of hands, it is the ingredient money that passes through it every day.
The data value of a dispensing robot: how to actually use usage, cost and reporting
When dispensing robots first arrived in the kitchen, everyone treated them as a machine that saves one person: weighing and dispensing automatically, taking the dispensing work off someone's hands. Use one for a while and you realise the valuable thing about a dispensing post is not the pair of hands, it is the ingredient money that passes through it every day. A single site's annual spend on sauces, powders, oil and salt runs from a few tens of thousands to a few hundred thousand; once a dispensing robot turns those quantities into data, the money it can save is often more than the labour it saves. This article takes the three kinds of data a dispensing machine produces — usage, cost and reporting — and explains how to use each one.
First work out where the hidden cost of a dispensing post actually sits
Manual dispensing has three things nobody can account for. The first is the wobble in the hand: the same spoonful, measured by different people in different moods, lands a few grams out, and over hundreds of portions a day that accumulates into something substantial — the real problem being that nobody knows where the difference came from. The second is the recipe quietly drifting: the cook feels it is a little salty or a little bland today and adds an extra spoonful, and the taste changes along with the cost, with nobody recording it. The third is stocktaking by guesswork: at month end the ingredients fall short and nobody can say whether sales rose, waste grew, or someone drew ingredients without booking them out. These three uncertain accounts are exactly what a dispensing robot can close, and they are the starting point of its data value.
Layer one: usage and variance — start with where the difference is
A dispensing robot records every dispense: which dish, which recipe, how much ingredient was actually used. With actual usage in hand, you can reconcile it against the recipe's theoretical usage. A normal variance rate runs within a few percentage points, accounted for by metering error and by changes in the moisture content of the materials. Once the variance rate passes about ten percent, stop and find out why: whether the machine's metering has drifted and needs calibration, whether the recipe has been edited, or whether someone drew a separate batch of ingredients outside the system. When selecting equipment, pin down the dispensing machine's metering accuracy and calibration interval: liquid and powder lines are metered to different accuracies, and higher accuracy reconciles more precisely — but higher is not automatically better, and enough is enough. Calibration service and consumable costs both have to go into the total account, because however high the accuracy, if it is not calibrated on schedule the data is fiction.
Layer two: cost — getting the ingredient cost of a single portion down to each dish
Usage data multiplied by purchase unit price gives you cost data. A dispensing machine can put the ingredient cost of a single portion down to the cent: how many grams a portion of sauce should use and what that comes to, priced in real time at that day's purchase price. Do not dismiss a difference of a few grams and a few cents. Take an example: a sauce costing 5.60 per kilo, with a standard portion of 30 grams, comes to about 17 cents. If every portion gets 5 grams more, that is 3 cents more per portion — 500 portions a day is 14 more, over 400 a month, and over 5,000 a year, which is half another machine. Once the cost of a single portion is pinned down, dish-level gross margin becomes something you can actually calculate; otherwise pricing and promotions are all guesswork.
The second use of cost data is recipe version control. Whether a recipe was changed, by whom, when and why is all on record in the system. Chain operators fear this most: each store's cook tunes the recipe by feel, the same dish ends up with ingredient costs a wide margin apart, headquarters cannot work out its gross margin whichever way it tries, and when you ask, the answer is always "the cook felt it needed it". Lock the recipe into the system and both output and cost become controllable: a new store opening gets the standard recipe issued directly, with no need to rely on a veteran cooking it into someone by hand.
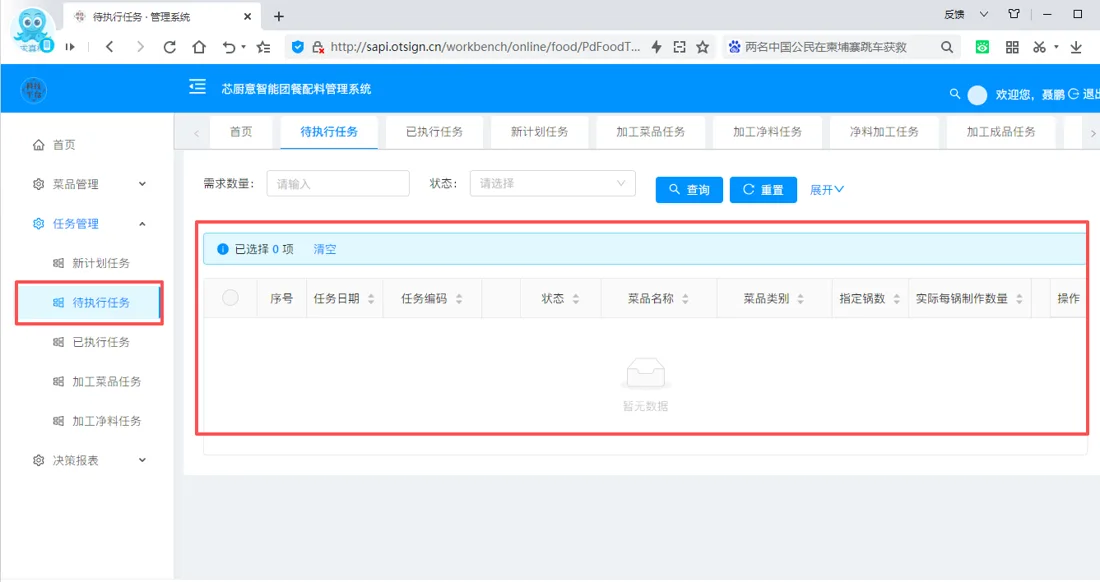
Layer three: reporting — show the right numbers to the right people
Data only becomes useful once it becomes a report, and a report only becomes useful once it is split by who reads it. What the store manager needs is daily usage and variance rate, with an automatic alert when a threshold is crossed, so the manager does not have to stare at reports every day — an exception is when they find out, and otherwise they get on with the work. What purchasing needs is weekly usage and trend, so that ordering has a basis instead of being guesswork, capital tied up in stock comes down and near-expiry waste falls. What the owner needs is ingredient cost per item, dish gross margin and cross-store comparison: same recipe and same sales, yet store A's ingredient cost runs eight percent above store B's — whether the problem is weighing habits or supervision shows up in one look. Cross-store comparison is one of the most valuable uses of dispensing data, but only if recipe versions are consistent across stores: where versions differ the comparison is meaningless, and the numbers it produces will mislead decisions.
More reports is not better
Sites that install dispensing robots tend to fall into the opposite trap: a great stack of reports printed out, and nobody reading them. The value of data lies in action, not in printing. A sensible start is three tables only: a daily variance table comparing actual against theoretical usage, with exceptions flagged automatically; a weekly cost table of ingredient cost and gross margin per item, gone through at the weekly meeting; and an exception alert covering variance past the threshold, recipes that have been edited, and calibration falling due, pushed to the right person. Once those three run smoothly, talk about adding requirements. Reports have to go to whoever can make a decision — the store manager can read them, the owner can see them, and only then will the data not rot inside the system. If the tables are set and nobody reads them, or they read and nobody acts, do not talk about data value yet: solve the management problem first.
Which sites should go first
Three types of operation deserve priority. Chain operators with three or more stores, where consistent recipes and cross-store comparison are worth the most, because an improvement at one store can be copied across all of them. Categories where sauces and powders are a high share of cost — malatang, hotpot, braised and marinated items, sauce-based fast food — where ingredient money is a large part of cost and a few points saved is pure profit. Operations with a central kitchen or centralised dispensing, where the dispensing machine sits in the central kitchen making standardised ingredient packs that stores simply open, saving at both ends. For a single store with low volume, where dishes are all mixed to order by the head chef, data-driven dispensing can wait: solve whether you have the problem before you solve whether you can count it. One line to remember at selection: with a dispensing machine you are buying data, not a metal shell — in a site that cannot put the data to use, even the most expensive machine is just a more accurate scale.
The content of this article is a reference for equipment selection. Specific figures are governed by the manufacturer's official parameters and on-site verification.